Migrate Statuspage to use Atlassian accounts
Learn everything you need to know to migrate you and your team to Atlassian accounts.
Uptime showcase displays the historical uptime of your components. Enabling this feature will add a 90-day uptime display to your status page, and a full historical account on the "/uptime" page.
Statuspage has traditionally been about communicating with your customers when things go wrong. You create incidents and degraded components when things break. It was a tool mainly used for support purposes.
The uptime showcase is a way to show all of the times when things were going great. Sure, you may have had a few blips over the year. But odds are that your overall uptime percentage includes at least two 9s. Now your status page can be used as a sales tool as well.
When you make one of your components "uptime-enabled", we'll start showing the past 90-days of uptime history on your status page.
Each day will appear somewhere on the scale of Green->Yellow->Orange->Red depending on how much downtime the component had. Days that had no or little downtime will appear as Green or Yellow, whereas days with more downtime will appear as Orange or Red.
An uptime percentage for the previous 90 days will appear under the colored bars.
The specific rules for how this works are detailed in the "How it works" section below.
See historical downtime numbers on a per-component basis in addition to seeing the incident history.
Users select which component they want to see uptime history for (from the list of components that you've made "uptime-enabled") and see the uptime percentage of previous months.
The individual days and monthly uptime percentages follow the same rules as the status page which are detailed in the "How it works" section below.
The rules used to determine the color that a bar is for a given day or the uptime percentage is for a period stems from the number of minutes that the given component is in the major outage or partial outage state. This means that if you have incidents but don't put components into one of these states, nothing will appear on a component's timeline.
While major outages affect 100% of the people that use a given component, partial outages only affect a subset of those users. Following that logic, partial outages don't count as much as major outages in your uptime showcase.
Specifically, partial outages are discounted to only be 30% as bad as major outages. This is an "across the board" calculation and cannot be configured.
Select a start date for your component for the most accurate representation of historical uptime. When you add a new component, the start date will default to the current date.
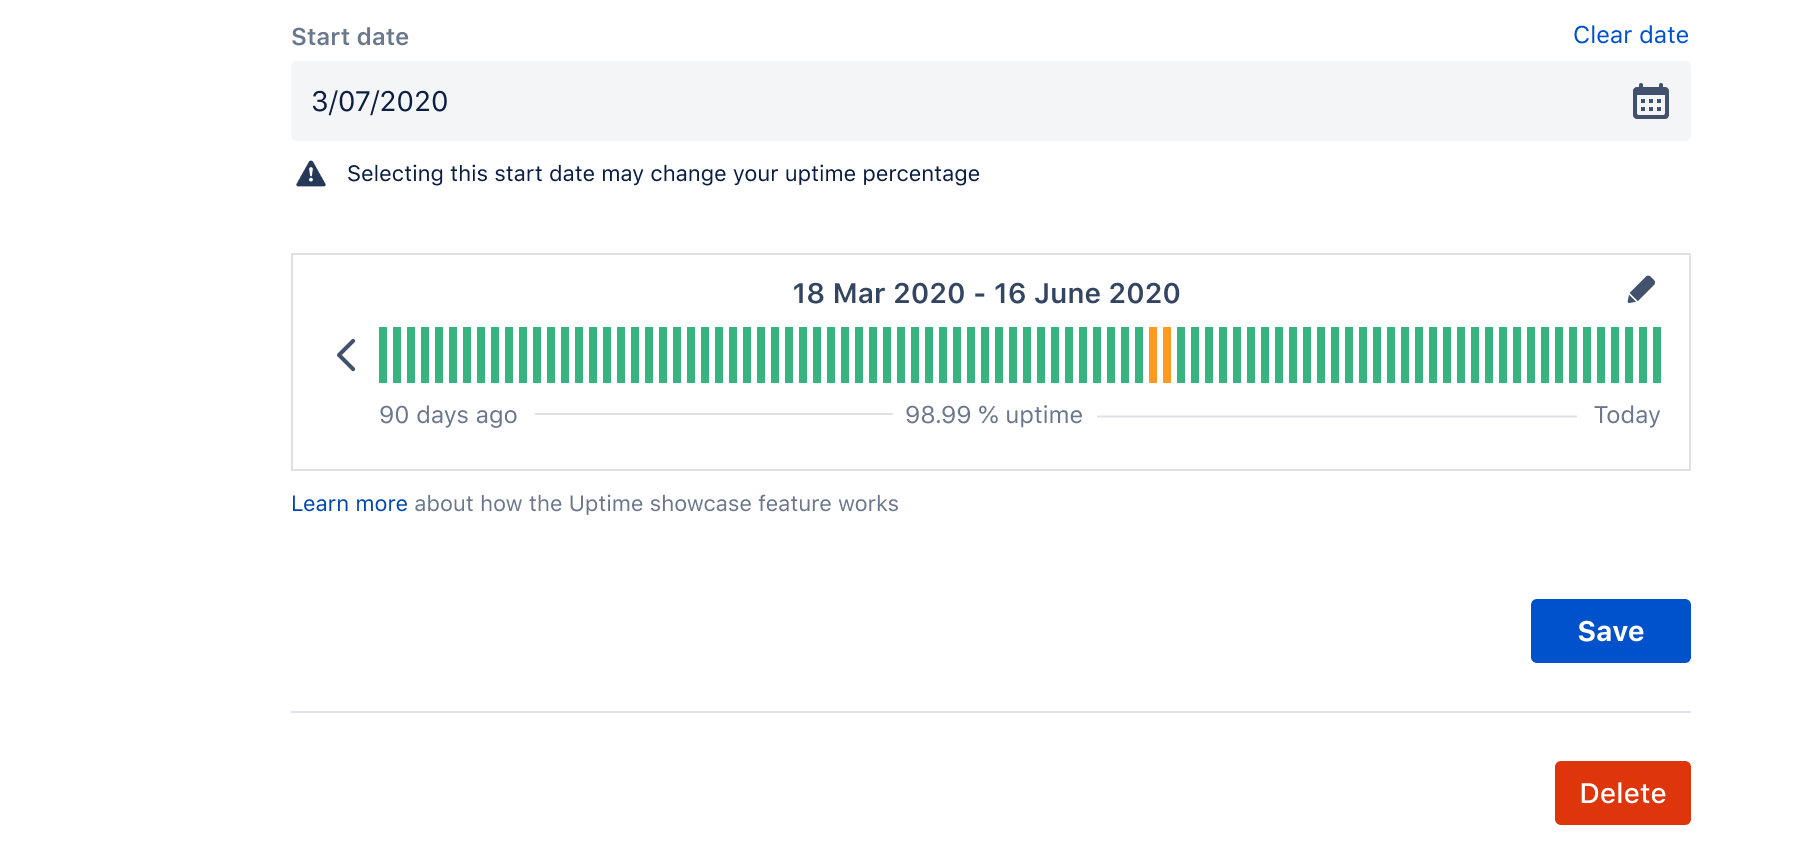
Changing the start date of existing components may impact the uptime percentage if you have recorded downtime. You will see the new uptime percentage calculated after you select Save.
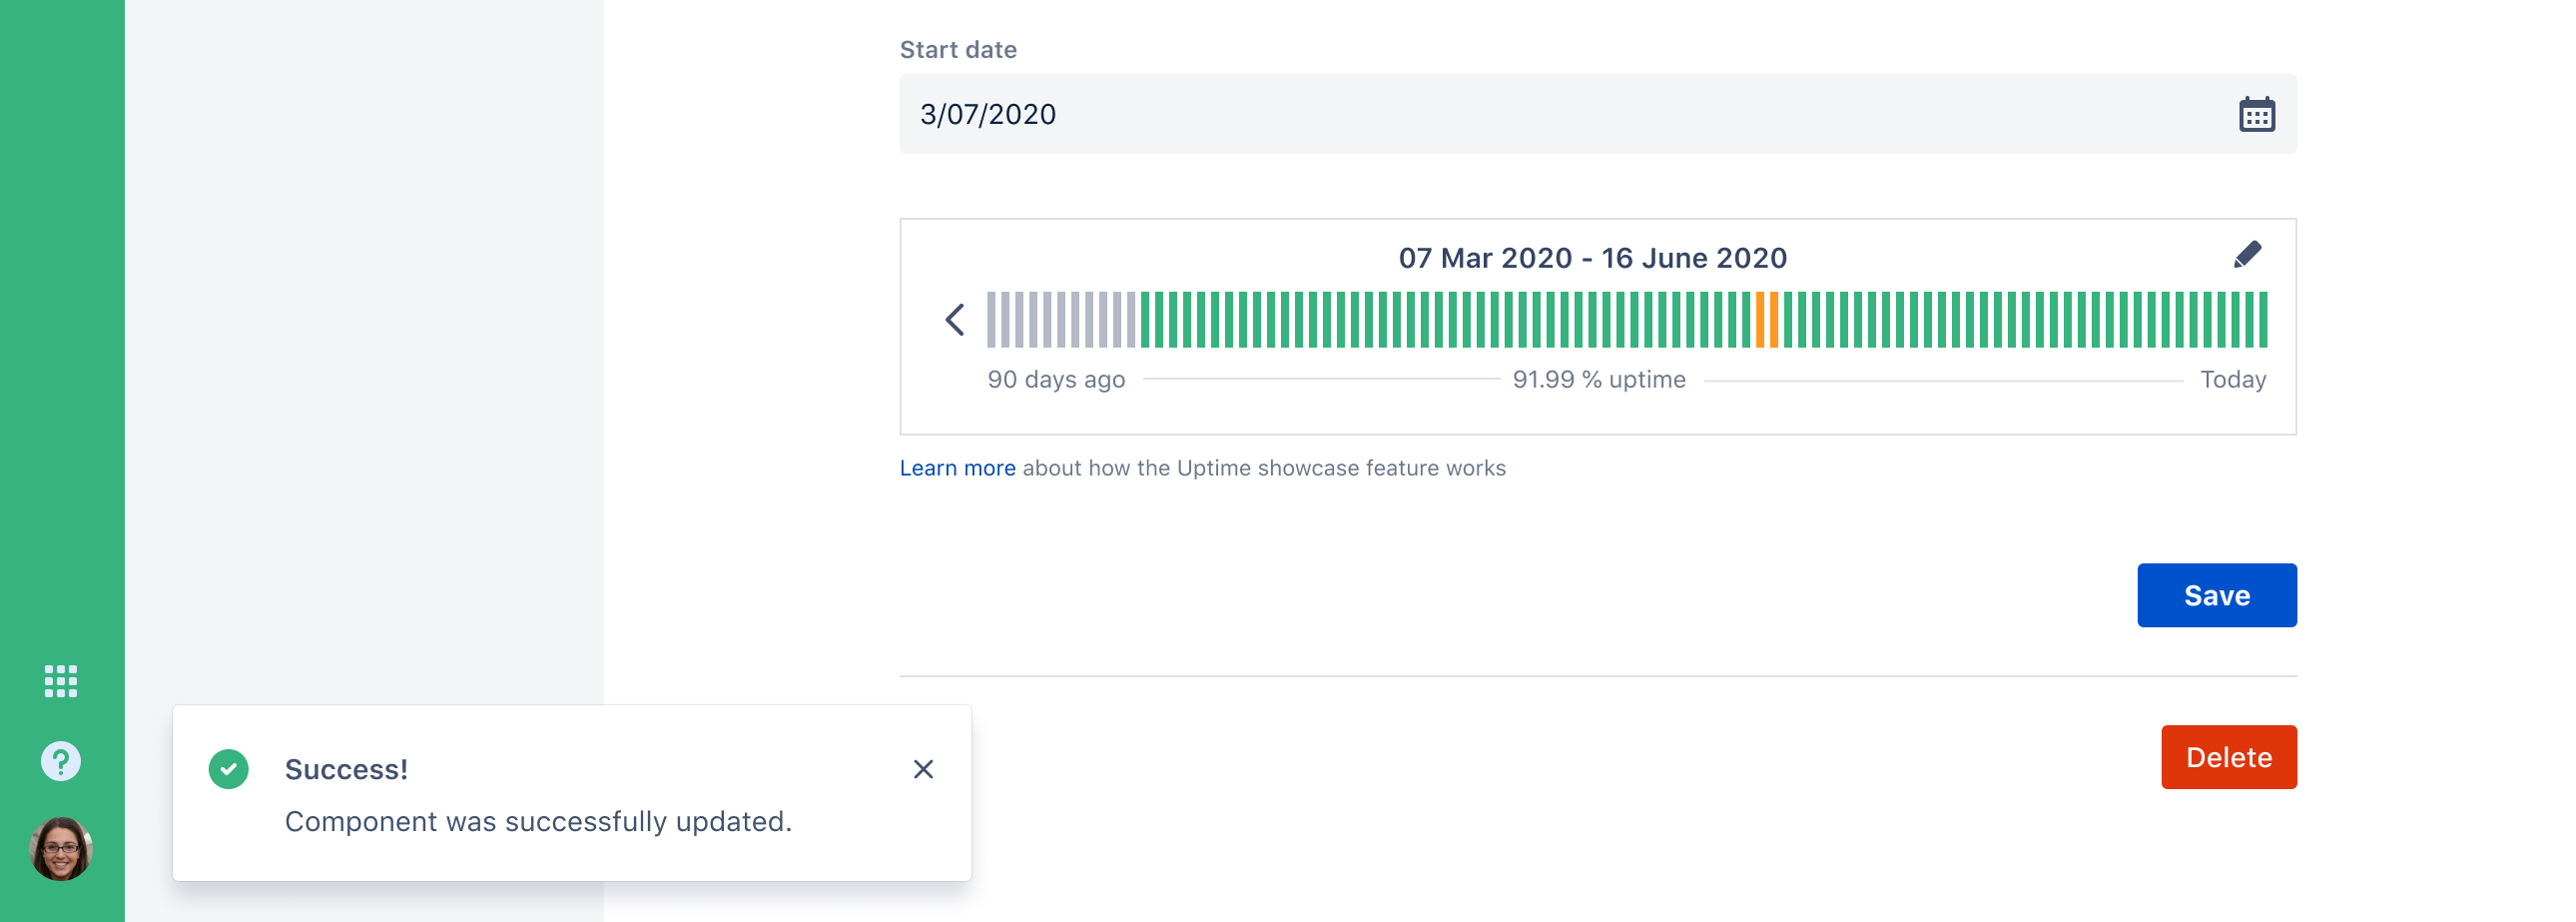
You can’t change the start date if you have downtime data recorded prior to the date you selected. You’d have to delete that recorded downtime data (incident or maintenance) in order to select that start date.
As the amount of downtime for a day increases, the color goes from green -> yellow -> orange -> red (as defined in the custom colors section set from Your page > Customize page and emails > Colors)
With any downtime at all, the day immediately jumps to half-way between green and yellow (mainly so that it's easy to distinguish days that had any amount of downtime vs. days that didn't). Days with no data are represented by a gray color.
From 1-20 minutes, the color of the day moves increasingly toward until it is fully yellow
From 20-40 minutes, the color of the day moves increasingly toward until it is fully orange
From 40-60 minutes, the color of the days moves increasingly toward until it is fully red. Anything over 60 minutes of downtime is also fully red
Keep in mind that both major outage and partial outage are counted. Per the discount on partial outages mentioned earlier, the formula for total minutes used to determine the color is:
Major outage minutes + (partial outage minutes * .3) = total minutes
The calculation for the uptime percentage of a given period uses similar logic used to determine the color of a given day.
(Major outage minutes + (partial outage minutes * .3)) / total minutes in the period
You may have had an incident but forgot to update your status page. Or you may have accidentally left an incident open for multiple days, so your component(s) never got flipped back to “Operational”. Don’t worry, you can edit your historical uptime/down so your status page always shows the most accurate information.
Click Components from the left sidebar.
Click Edit on a component that’s currently being showcased.
Either:
a) Click the pencil icon on the uptime showcase UI or
b) hover over the graph and click on a specific day.
Modify the hours and minutes of major outage and degraded performance for a given component.
Click the check mark in the top right to save your changes. Your changes will be reflected immediately on your status page.
Tip: You can modify the “hrs” and mins” values using the UP and DOWN arrows on your keyboard.
If there was component downtime and is listed as an affected component on an incident or maintenance on the same day, hovering over that bar will provide a clickable link to the related event.
You can make a given component "uptime-enabled":
Click Components from the left sidebar.
Click Edit for a given component
Select the checkbox to Display the historical status of this component on my status page.
Click Save component.
Component groups aren't set up to be uptime-enabled explicitly, but implicitly by making one or more of the children uptime-enabled.
When a component group has children that are uptime-enabled and is collapsed, a rolled-up average will be displayed as a colored bar for a given day. Hovering over a bar shows how many components were impacted, and clicking will expand the group so that each individual component can be inspected.
The "degraded performance" and "under maintenance" states are not considered for this feature. Our stance is that while degraded performance (i.e. things are just running slow) does affect user experience, it's not technically downtime. We also think scheduled maintenance generally shouldn't factor in and this feature is more for displaying unplanned downtime.
We know that these opinions vary from organization to organization, so we may add options to include these things in the future.
Note: if component subscriptions are enabled, deleting a component and creating a new one means you will lose all subscribers of the original component.
Was this helpful?